Once you have started using Tasks for your jobs, projects and timesheets, you can learn from them over time.
Tasks (also known as Stages or Phases) can be used to see how good staff are in getting through work allotted to them, as well as how good you are in your estimates.
You can analyse data entered against tasks either as hours worked or a budget amount.
Even if you don’t have a budget or estimate for a task (be it a variation, or something that you are charging at an hourly rate) it is a good idea to assign the item of work as a task to your job/project. You can leave the hours and fee value equal to zero.
Later on you can look at the actual time and cost assigned to the task and get a better idea of budgeting for the next job of the same type. Or you can use the tasks to simply know approximately how much time these variations to jobs typically take (and how they can affect staffing and scheduling of other jobs).
After using Abtrac for about 18 months, one of our clients, told us “I work out the budget very scientifically and then I add on 30%”.
He had learnt after using Abtrac for that period of time that he was under-quoting and thus writing off to that extent on nearly every job/project.
The are seven main variations of Actual vs Budget reports
- Actual vs Budget Summary by Job
- Actual vs Budget by Job*
- Actual vs Budget by Job and Task*
- Actual vs Budget by Job Task and Additional Values*
- Actual vs Budget by Job and Task (Fees only)*
- Actual vs Budget by Job and Task (Hours only)*
- Actual vs Budget by Job and SubTask
*These reports compile large quantities of data. If you have a large number of current clients and jobs you may find it more efficient to filter these more detailed reports by Office, Client, Job or Project Manager – rather than running the reports for all jobs in your system.
Actual vs Budget Summary by Job
Actual vs Budget Summary by Job displays the Client Name, Job Code, Job Description, and optionally groups/filters by Job Owners.
For each it gives the Estimated Hours, Actual Hours worked, Job Fee Budget (Fee Estimate/Fixed Fee), Actual Value of Time, Variance (between fees), Invoice To Date and the Percentage Fee Consumed.

Actual vs Budget by Job
Actual vs Budget by Job displays Client Name, Job Code, Job Description, and the Fixed Fee from Job Billing Details.
For each job, it gives a totals line showing: Fixed Fee, WIP Value Fee Contribution, Estimated Hours, Actual Hours, Variance (between hours), Estimated Value, Actual Value, Variance (between values of work), Percentage Fee Consumed.
As well as a total, the report details the Employee names, charge rates and extensions for all the actual hours worked. If you have built up your estimates using sub-tasks, then these lines will include estimates for each employee as well as for the job as a whole.

Actual vs Budget by Job and Task
Before previewing the Actual vs Budget by Job and Task report you can choose whether charge, cost or scaled cost rate is used for actual values.
The report displays Client name, Client Code, Job Code, Job Description, and the Fixed Fee from Job Billing Details. The report groups Actual vs Budget totals by Client as well as by Job.
For each Job the report details each Task and shows: WIP Value Fee Contribution, Estimated Hours, Actual Hours, Variance (between hours), Estimated Value, Actual Value, Variance (between values of work), Percentage Fee Consumed, and a Progress Assessment.

If you use Task Groups then the Actual vs Budget by Job and Task report will first order and group by Task Groups, and then by Task.

Chart of Actual vs Budget by Job and Task
This gives a visual representation of the Actual vs Budget by Job and Task.

Actual vs Budget by Job, Task and Additional Values
The report displays Client name, Client Code, Job Code, Job Description, Job Owner, and the Fixed Fee from Job Billing Details.
For each Job the report details each Task and shows:
Estimated Hours (Original), Projected Additional Hours, Actual Hours, Variance, Estimated Value (Original), Projected Additional Value, Actual Value, Variance, Disbursements (Actual), Disbursements Budget to Completion, Forecast Completed Value.
Variance here means Estimate + Additional – Actual

Actual vs Budget by Job and Task (Fees only)
The report displays Client name, Client Code, Job Code, Job Description, Job Owners, and the Fixed Fee from Job Billing Details. It groups Actual vs Budget totals by by Job.
For each Job, the report details each Task and shows: Fee estimate, Fees invoiced*, Revenue without WIP, Actual Fees percentage spent, Unbilled Fees, Date of Last Invoice, Percentage progress assessment, Sub Consultant fees budgeted, and Sub Consultant fees invoiced*, Disbursements Fees and Disbursements Invoiced*.

*This report is only available for billable jobs. And the report will only show relevant billable/invoiced information where the invoice line amount also has a relevant time or cost line assigned to it.
If there is no assigned time or cost, then the invoiced amount is unable to be assigned to a task – and the invoiced amounts will not match your invoice listing totals.
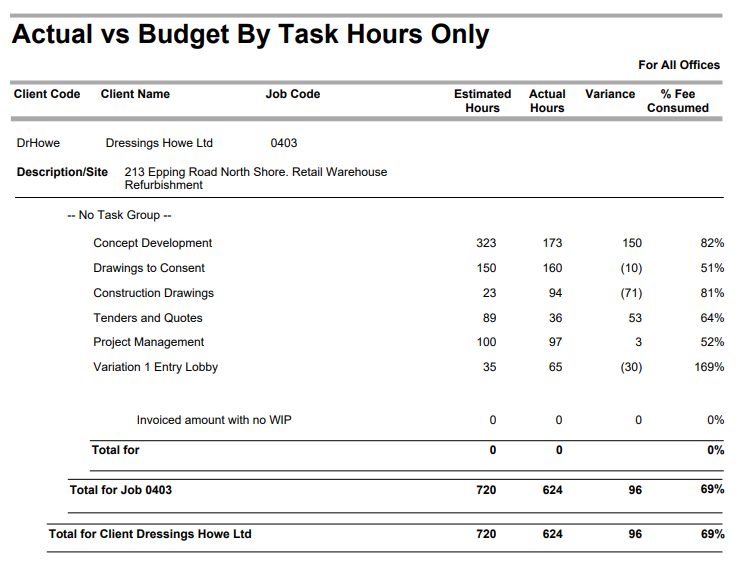
Actual vs Budget by Job and Task (Hours only)
The report displays Client name, Client Code, Job Code, and Job Description. It groups Actual vs Budget totals by Job.
For each Job, the report details each Task and shows: Estimated Hours, Actual Hours, Variance (between hours), and the percentage fee consumed. If Task Groups are used, the report will also show Task Groups.
Actual vs Budget by Job and SubTask
Displays Client name, Job Code, Job Description, and the Fixed Fee from Job Billing Details. The report will also optionally group by Job Manager.
For each job, it shows: Fixed Fee, WIP Value Fee Contribution, Estimated Hours, Actual Hours, Variance (between hours), Estimated Value, Actual Value, Variance (between values of work), Percentage Fee Consumed, and a Progress Assessment.
This report is an extension of Actual vs Budget by Job. All amounts are broken down further by Task, and then Sub Tasks (Employees), Disbursements are also included and detailed line by line.
Totals are given by Task, and for the entire Job.

Glossary: Actual vs Budget data
We’ve included a definition for the relevant columns in the report images above, (including an example calculation where applicable).
- Actual Hours
- Actual Value
- Consultant Fees
- Consultant Fees invoiced
- Disb Budget to Completion
- Disbursements invoiced
- Fee/Fixed Fee/Fee Estimate
- Fee Estimate
- Fees invoiced
- Forecast Completed Value
- Percentage Fee Consumed (% Fee Consumed)
- Percentage of Budget Spent/ %ge of Budget Spent
- Progress Assessment
- Projected Additional Hours
- Projected Additional Value
- Job Fee Budget
- WIP Value Fee Contribution
- Unbilled Fees
- Variance
- Actual Hours– A sum of the total hours spent on the job/project, sometimes rounded to a whole number. In some reports you can choose whether to show the Actuals for the life of the Job, or for a certain date range.


- Consultant Fees invoiced – shows the invoice line amount for that task. This field will only show an invoiced amount in Actual vs Budget reports if the invoice line amount also has a sub-consultant disbursement assigned to it. If there is no disbursement, then the invoiced amount is unable to be assigned to a task.
- Disb Budget to Completion – used in place of the Disbursements estimate for a task and displayed in the Actual vs Budget by Job, Task and Additional Values report
- Disbursements invoiced – shows the invoice line amount for that task. This field will only show an invoiced amount in Actual vs Budget reports if the invoice line amount also has a disbursement assigned to it. If there is no disbursement, then the invoiced amount is unable to be assigned to a task.
- Fee/Fixed Fee/Fee Estimate – This is the Fee estimate from your Job Billing Details. It will be the sum of your task fee estimates. Alternatively, you can enter a single amount directly into this field.

- Fees invoiced – shows the invoice line amount for that task. This field will only show an invoiced amount in Actual vs Budget reports, if the invoice line amount also has time assigned to it. If there is no time, then the invoiced amount is unable to be assigned to an task.
- Forecast Completed Value – displayed in the Actual vs Budget by Job, Task and Additional Values report. A calculation of :
Estimated Value + Projected Additional Value + Disbursements Actual + Disbursements Budget to Completion = Forecast Completed Value
- Percentage Fee Consumed (% Fee Consumed) – The fee estimate less the actual value.
- Percentage of Budget Spent (%ge of Budget Spent) – Actual Fees divided by the Fees invoiced (Another way of looking at write ons/ write offs)
- Projected Additional Hours – a second estimate of time against a task with an original hours budget
- Projected Additional Value – the additional fee value calculated from any Projected Additional Hours
- Progress Assessment (% Progress) – usually entered by the job manager, it indicates how far through each stage the team feel they are – “I think we’re nearly halfway” etc…This percentage is not related to any estimates or actual amounts. From the Job Tasks screen right click on any task line to enter one of more progress assessments for each task.


- WIP Value Fee Contribution – the value of hours worked by each employee on the job, apportioned to the total Fees invoiced. For the WIP Value Fee Contribution figure to be relevant, all hours worked on a job must be assigned to an invoice line amount (even if that amount is zero). See this explanation of fee contribution for examples
- Unbilled Fees – the value of any time for a task which is yet to be assigned to an invoice line.
- Variance – the difference between the budget amounts and actuals in each report. This will be either hours, value of hours, fees etc.
Abtrac KB# 2067