
The Billable Job Delivery widget provides a calendar year-to-date summary of billable job activity, showing how many billable jobs have been started, completed, and how long completed jobs typically take to deliver.
This widget helps management monitor project delivery performance and identify trends in project duration over the current calendar year.
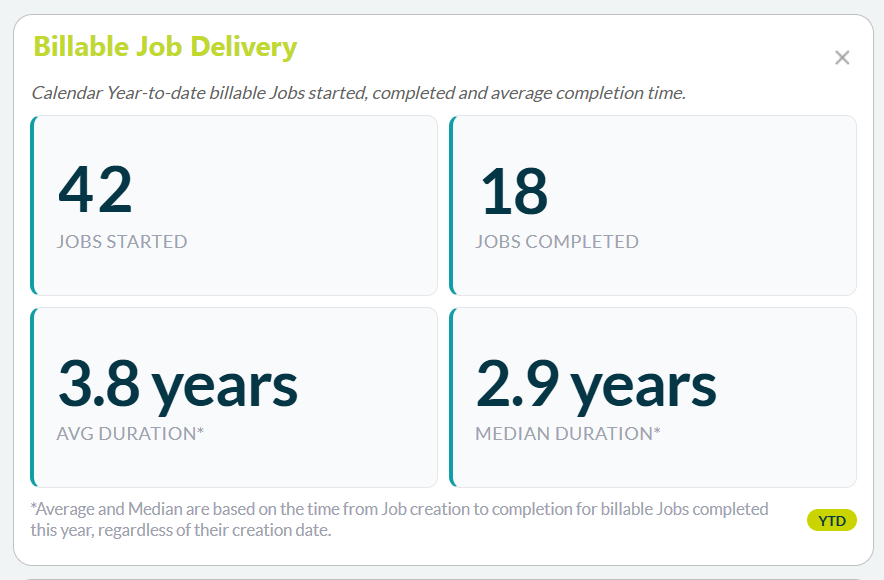
Billable Project Delivery Widget
The Billable Project Delivery widget displays four key metrics for billable jobs within the current calendar year:
Jobs Started
The number of billable jobs that have been started during the current calendar year, based on the Job Creation date.
Jobs Completed
The number of billable jobs that have been completed during the current calendar year, based on the Job Completion date (Actual Completion).
Average Duration
The average time between job creation and job completion for billable jobs completed during the current calendar year.
Because averages can be influenced by unusually long or short projects, this figure should be considered alongside the Median Duration.
Median Duration
The median (middle) duration between job creation and completion for billable jobs completed during the current calendar year.
The median duration often provides a more representative view of typical project delivery time because it is less affected by extreme values.
Note: Average and Median Duration are calculated using billable jobs completed during the current calendar year, regardless of when the jobs were originally created.
Understanding the Billable Project Delivery widget numbers
The figures displayed provide a high-level indication of project throughput and delivery performance.
For example:
- A high number of Jobs Started compared to Jobs Completed may indicate a growing workload.
- A high number of Jobs Completed may indicate strong project delivery performance.
- Changes in Average or Median Duration may indicate changes in project complexity, resourcing, workflow efficiency, or the type of projects being undertaken.
The counts shown in this widget are summary totals. The figures displayed in this widget can be reviewed in greater detail using the filters available in the Current Clients and Jobs search screen.
By filtering for:
- Billable jobs
- Job status
- Job Creation dates
- Job Completion dates
Billable Project Delivery Widget Availability and Configuration
The Billable Project Delivery widget is available on the Abtrac Home Page and may be displayed or hidden depending on user preferences and system configuration.
For information about managing access to Home Page widgets, see these articles:
Home Page Widgets – Administrator Controls
Abtrac KB# 2280